📊 Measure Market Segmentation Success (KPIs and Simple Dashboards)
📊 Measure Market Segmentation Success (KPIs and Simple Dashboards)
A scary thing happens when we “do marketing” without measurement.
We feel busy… but we don’t know what is working.
And when we don’t know, we guess.
Guessing burns money. Guessing burns time. Guessing burns confidence.
That’s why we measure market segmentation success slice by slice. Not blended. Not “overall.” Slice by slice.
When we do that, the truth shows up fast:
Which target audience slice is clicking
Which slice is staying
Which slice is asking good questions
Which slice is buying
Which slice is refunding (or not)
This is how we create calm growth inside The Buyer Clarity System™.
Measure market segmentation with a few simple KPIs (CTR, time, bounce, CTA clicks, conversion, CAC, LTV). Build a slice-level dashboard. Review weekly. Use a fix-it playbook when numbers dip.
💡 Why market segmentation measurement matters (more than “more content”)
If we don’t measure, we can’t learn.
And if we can’t learn, we can’t improve.
Market segmentation measurement matters because it:
Stops wasted spend on the wrong target audience
Shows which slice is “hot” right now
Helps our buyer persona stay real
Uses consumer behavior (actions) instead of opinions
Builds buyer clarity (we know the next move)
Busy is not the goal. Clear is the goal.
🔎 What “success” means in market segmentation (simple definition)
Market segmentation success means:
✅ One slice is responding better than the others.
✅ That slice is moving forward with less friction.
✅ The cost to get a lead is stable (or dropping).
✅ The value of that buyer is stable (or rising).
In simple words:
The right people are clicking, staying, and buying.
🧩 What to measure in market segmentation (the whole path)
Most people measure only ads.
But market segmentation happens across the whole path:
Ad or search result → click
Landing page → trust
CTA → action
Form → lead
Call/trial → decision
Purchase → value
Repeat/refund → long-term truth (LTV)
So we measure each step. Slice by slice.
📈 The “must-track” KPIs for market segmentation (with plain meanings)
Below are the KPIs that matter most. Keep them simple.
🎯 CTR for market segmentation (Do they care?)
CTR = click-through rate.
It tells us if our message matches the slice.
Low CTR = wrong hook for that target audience
Higher CTR = “This feels like me” for that slice
What to do if CTR is low: Change the headline angle (pain vs dream vs proof). Use buyer words.
⏱️ Time on page for market segmentation (Do they trust?)
Time on page shows if people stay long enough to understand.
Low time = mismatch or confusion
Higher time = interest and trust growing
What to do if time is low: Tighten the hero. Add a 3-step path. Move proof up.
🚪 Bounce rate for market segmentation (Did they leave fast?)
Bounce means they leave without doing anything.
High bounce = page promise doesn’t match the click
Lower bounce = the page feels right for that slice
What to do if bounce is high: Match ad promise to page headline (same words). Reduce clutter.
🖱️ CTA clicks for market segmentation (Do they want the next step?)
CTA clicks show if the next step feels safe.
Low CTA clicks = step feels risky or unclear
Higher clicks = “I can do this”
What to do if CTA clicks are low: Move proof by the button. Add micro-FAQ under the CTA. Make the CTA smaller (guide) for cold slices.
🧾 Conversion rate for market segmentation (Did they take the step?)
Conversion rate = % who opt in, start trial, or book.
This is one of the clearest signals that a slice is working.
What to do if conversion is low: Reduce form fields. Make the offer match stage (cold/warm/hot). Fix friction on mobile.
💰 CPL / CPA for market segmentation (Can we afford it?)
CPL = cost per lead
CPA = cost per action (trial, booking, purchase)
Low CPL is not always good if leads are junk.
We want healthy CPL and good quality.
What to do if CPL rises: Narrow the slice, improve the hook, or change channel.
📞 Lead-to-call and call-to-close for market segmentation (Do they buy?)
These show real buying intent for that slice.
Low lead-to-call = wrong offer size or weak trust
Low close rate = wrong promise or wrong slice fit
What to do if close rate drops: Tighten “For/Not-for.” Add slice-specific proof. Fix expectations.
🔁 LTV for market segmentation (Do they stay and buy again?)
LTV = lifetime value.
It shows if a slice is truly a good fit long-term.
What to do if LTV is low: Your slice may be wrong, or your promise may be too broad. Improve onboarding and set clearer expectations.
🧠 The biggest rule in market segmentation measurement: never blend slices
If we blend slices, we lose the truth.
Example:
Slice A clicks a lot but never buys.
Slice B clicks less but buys more.
If we blend, we see “average.”
Average hides the winner.
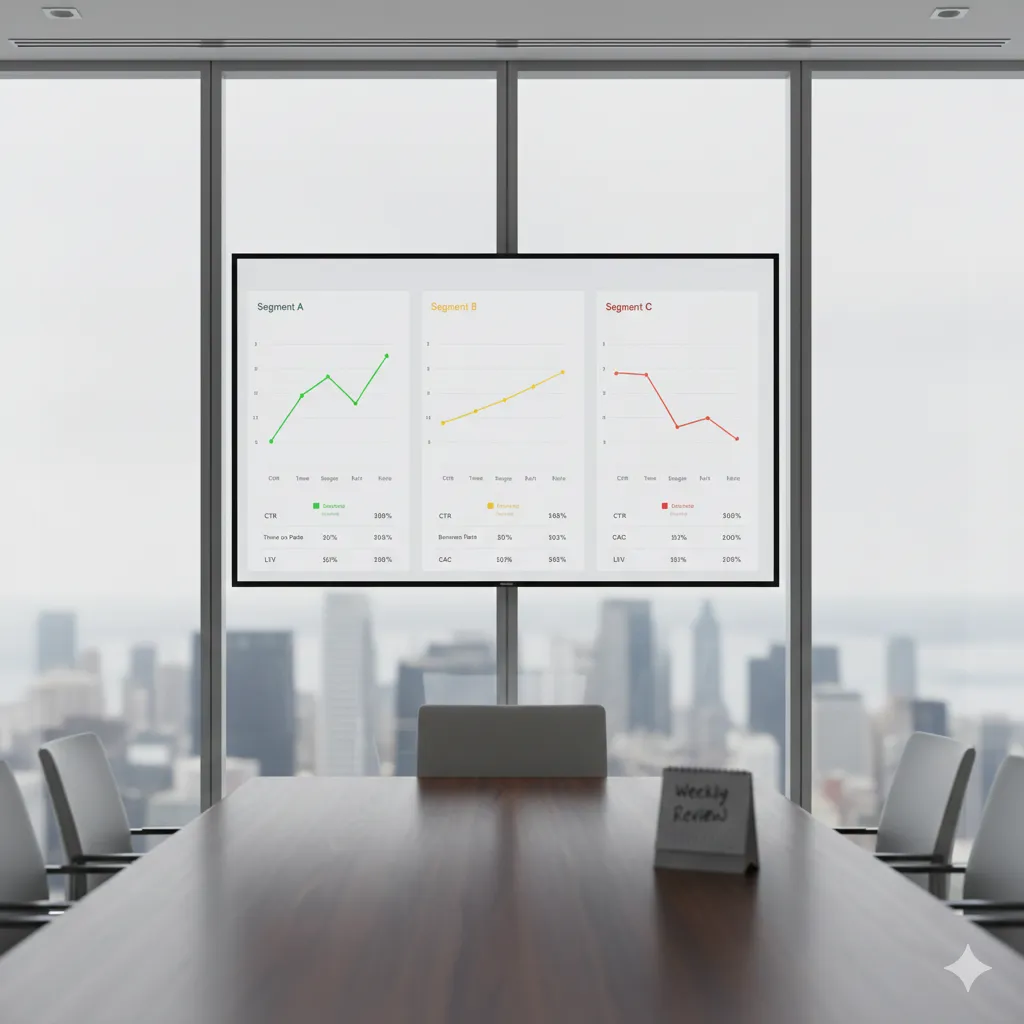
So we always measure:
✅ Slice A dashboard
✅ Slice B dashboard
✅ Slice C dashboard
That’s how we find the real target audience.
🧱 How to build a simple market segmentation dashboard (no fancy tools)
We can do this with:
a spreadsheet
basic analytics
ad platform numbers
simple CRM stats (calls, closes)
That’s enough.
🧾 What columns to use in a market segmentation dashboard
Create one row per slice, per week.
Include:
Slice name (the target audience slice)
Channel (search, social, email, etc.)
Offer (guide, trial, call)
CTR
CPC (optional)
Time on page
Bounce rate
CTA clicks
Conversion rate
CPL / CPA
Lead-to-call %
Close %
Refund % (if relevant)
LTV (monthly check is fine)
Notes (what people asked)
Keep it simple. Keep it readable.
🗂️ How to label slices in a market segmentation dashboard (clear names)
Bad slice names:
“Segment 1”
“Group A”
“Audience test”
Good slice names:
“Urgent help this week”
“Burned before, needs proof”
“Low budget, high need”
“Sensitive skin fear”
“Month-end chaos ops”
When slice names are clear, actions are clear.
🧭 How to set targets for market segmentation KPIs (easy ranges)
Every business is different, but we can use simple “watch zones.”
✅ Simple watch zones for market segmentation
CTR: if it drops for 2 weeks, fix the hook
Time on page: if it drops hard, fix page clarity
Bounce: if it spikes, fix message match
CTA clicks: if flat, move proof + add FAQ
Conversion: if down, reduce friction + change offer size
Close rate: if down, tighten fit + promise
We don’t need perfection.
We need signals.
🔁 Weekly review cadence for market segmentation (15 minutes)
We keep this light. Small businesses need simple.
🗓️ Weekly rhythm for market segmentation
Monday: check last week’s slice dashboard
Pick one red number: the first broken link
Choose one change: headline OR CTA OR proof OR FAQ order
Run one week: no extra changes
Next Monday: call a winner and log it
One change. One week. One winner.
That is how consumer behavior becomes growth.
🧰 The fix-it playbook for market segmentation (what to do when numbers dip)
When a slice dips, we don’t panic.
We follow a calm checklist.
🧯 If market segmentation CTR is low
Fix the message before anything else.
Use pain-first headline for cold traffic
Use proof-first headline for warm traffic
Use exact buyer words from reviews/inbox
Make the promise specific (time + outcome)
🧯 If market segmentation time on page is low
Fix clarity and layout.
Shorten hero text
Add a 3-step path with time tags
Remove extra offers
Add “For/Not-for” box
🧯 If market segmentation bounce is high
Fix the match.
Ad promise must match page headline
Same slice, same words, same outcome
Remove confusing nav links on landing pages (optional)
Make the first screen feel safe and clear
🧯 If market segmentation CTA clicks are low
Fix trust at the click.
Put proof by the CTA
Add micro-FAQ under the button
Make CTA safer (guide instead of call) for cold slices
Make the button bigger on mobile
🧯 If market segmentation conversions are low
Fix friction.
Reduce form fields (3–5 max)
Use the right keyboard on mobile
Make the offer smaller or clearer
Add “what happens next” under the form
🧯 If market segmentation close rate is low
Fix fit and expectations.
Tighten “Who this is for/not for”
Add slice-specific proof (people like them)
Add a “week one win” checklist
Make pricing and steps clear
🧯 If market segmentation refunds are high
Fix the promise.
Clarify what is included and not included
Make the “not for you” list stronger
Add setup and success steps
Make onboarding easier
Refunds are not just “bad buyers.”
Refunds are often “unclear promises.”
🧪 Slice-level examples for market segmentation measurement (service, SaaS, local, ecommerce)
🛠️ Service example for market segmentation measurement
Slices:
“Burned before, needs proof”
“Urgent help this week”
“DIY tried, still stuck”
What we see:
Proof-seeker slice: high time on page, lower CTR
Urgent slice: higher CTR, faster CTA clicks
DIY slice: low close rate until we add a smaller offer
Fix:
Proof-seeker: add like-me proof by CTA
Urgent: add “48-hour first win” and urgent bundle
DIY: offer guide first, then call later
💻 SaaS example for market segmentation measurement
Slices:
“Month-end chaos ops”
“Finance leader wants control”
“Freelancer forgets invoices”
What we see:
Ops slice: high trial starts, medium close
Finance slice: fewer leads, higher close
Freelancer slice: high clicks, low LTV
Fix:
Ops: add onboarding support
Finance: add ROI proof and integration list
Freelancer: offer a simpler plan or shift focus away
📍 Local example for market segmentation measurement
Slices:
“Busy parents nearby”
“New lifters”
“Event-ready urgent”
What we see:
Parents: high mobile traffic, low form completion
New lifters: steady bookings
Urgent: spikes seasonally, higher close
Fix:
Parents: shorter form + sticky CTA + class times first
New lifters: keep steady, add referral CTA
Urgent: promote jumpstart plan with limited spots
🛒 Ecommerce example for market segmentation measurement
Slices:
“Sensitive skin fear”
“Acne teen”
“Anti-aging planner”
What we see:
Sensitive skin: lower CTR but higher conversion with sample kit
Acne teen: high CTR, higher returns if expectations are unclear
Anti-aging: higher AOV, slower buying cycle
Fix:
Sensitive: keep sample kit, add ingredients clarity
Acne: add “For/Not-for” and routine steps
Anti-aging: add compare pages and email follow-up
🧠 What most people miss in market segmentation dashboards (the real win)
Most people track only clicks.
But the real win is tracking:
questions
objections
reasons people hesitate
reasons people refund
words they use when they buy
So in our dashboard, we always keep a “Notes” column.
Because those notes feed:
better copy
better offers
better FAQs
better pages
better buyer persona truth
Numbers show “what.”
Words show “why.”
❓ FAQ (AEO-Ready) for market segmentation measurement
What KPIs prove market segmentation is working?
For market segmentation, track CTR, time on page, bounce rate, CTA clicks, conversion rate, cost per lead, close rate, refunds, and LTV by slice.
Should we track market segmentation results by slice or overall?
Track market segmentation by slice. Overall numbers hide winners and losers.
What is the most important market segmentation KPI first?
Start with CTR and conversion. CTR shows message fit. Conversion shows action fit.
How often should we review market segmentation dashboards?
Review market segmentation weekly. Do a deeper review monthly and a bigger refresh every 6–12 months.
What is a simple market segmentation dashboard?
A simple market segmentation dashboard is a spreadsheet that tracks key KPIs per slice each week, plus a notes column for buyer questions.
What does high bounce mean in market segmentation?
In market segmentation, high bounce often means the ad promise does not match the landing page, or the slice is wrong.
What do we change first when market segmentation numbers drop?
For market segmentation, change the first broken link: hook (CTR), clarity (time/bounce), trust (CTA clicks), friction (conversion).
How do we measure market segmentation for email?
For market segmentation email, track open rate, click rate, reply rate, and conversion to the next step—by slice.
What does LTV tell us about market segmentation?
In market segmentation, LTV tells us if the slice is a long-term fit, not just a short-term click.
How do we use consumer behavior in market segmentation dashboards?
In market segmentation, consumer behavior shows up as clicks, time, scroll, questions, purchases, and refunds. Track both numbers and buyer words.
📌 Key Takeaways for market segmentation success
Measure market segmentation slice by slice, not blended
Track simple KPIs: CTR, time, bounce, CTA clicks, conversion, CPL, close, refunds, LTV
Build a simple dashboard (spreadsheet is fine)
Review weekly in 15 minutes
Fix the first broken link (hook → clarity → trust → friction → fit)
Track buyer questions too, not just numbers
Let consumer behavior guide every change
This creates buyer clarity inside The Buyer Clarity System™
🎁 Complimentary Ebook
Want the dashboard template and the fix-it checklist in one place?
Grab our COMPLIMENTARY Buyer Clarity Guide here:
👉Download your complimentary ebook now
🧭 Final Word
Small businesses don’t win by doing more.
They win by learning faster.
Measure market segmentation slice by slice.
Let consumer behavior tell the truth.
Keep the winners. Fix the weak links.
That’s how we grow with calm confidence—inside The Buyer Clarity System™.
