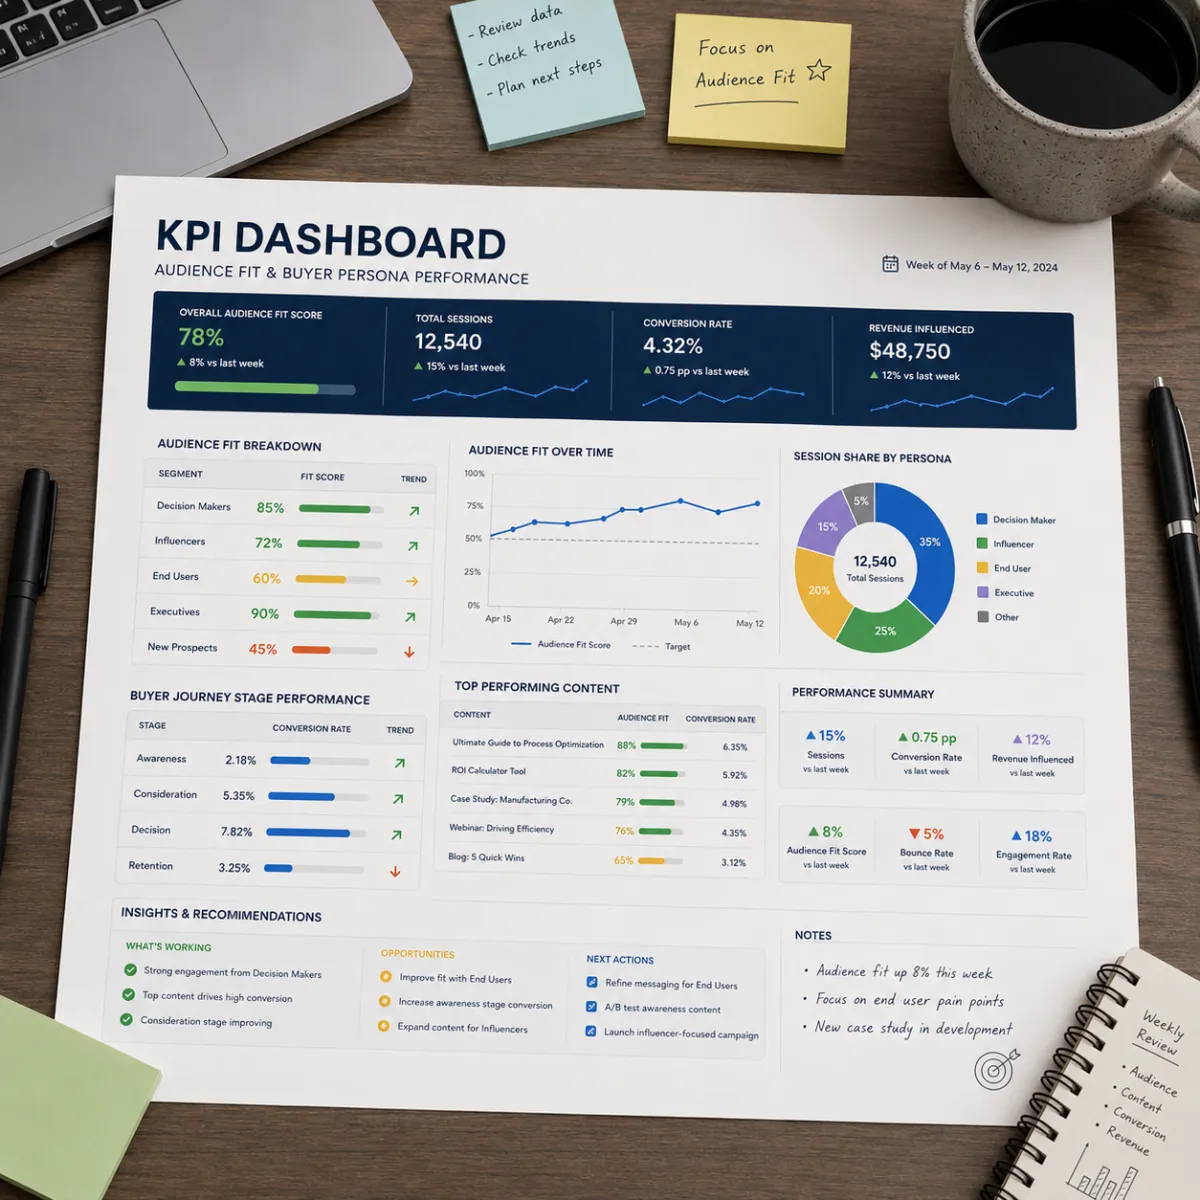
📊 One-Sheet Dashboard: Target Audience Fit & Buyer Persona Performance
📊 One-Sheet Dashboard: Target Audience Fit & Buyer Persona Performance
When marketing feels messy, it’s usually because we can’t answer one simple question:
Is our target audience right… and is our buyer persona message working?
If we don’t know, we guess.
If we guess, we waste time.
If we waste time, we lose confidence.
So we build one sheet.
Not a fancy tool.
Not a huge report.
One simple dashboard that tells the truth using consumer behavior.
Target audience fit is measured by CTR + bounce + lead quality. Buyer persona performance is measured by time on page + CTA clicks + conversions + close rate + time-to-yes. Track both weekly on one sheet, use green/yellow/red thresholds, and follow a fix-first flow.
🧠 Simple definitions (so we measure the right thing)
🎯 Target audience fit
Target audience fit means: are we aiming at the right group?
If fit is good, we see:
better CTR
lower bounce
better lead quality
👤 Buyer persona performance
Buyer persona performance means: does our message match the buyer’s brain?
If performance is good, we see:
higher time on page
more CTA clicks
more conversions
better close rate
faster time-to-yes
Target audience = who sees it.
Buyer persona = what makes them act.
🎯 Why one-sheet beats “more tools”
Most teams don’t need more software.
They need clarity.
A one-sheet dashboard works because it forces:
focus
consistency
weekly learning
clean tests
It also helps you avoid the classic mistake:
Changing everything at once.
🧩 The dashboard rule: track by slice, not in a blend
Blended numbers lie.
If we mix slices together, we can’t see:
which target audience is best
which buyer persona message is best
what to fix first
So the sheet must track:
slice (audience/persona)
channel
page/offer
One row per slice per week.
🧾 The one-sheet dashboard (what you track)
We track 7 core KPIs:
🎯 Target audience fit KPIs
CTR (do the right people click?)
Bounce rate (did we match their intent?)
Lead quality (are leads a fit?)
👤 Buyer persona performance KPIs
Time on page (do they trust?)
CTA click rate (does the step feel safe?)
Conversion rate (do they act?)
Close rate + time-to-yes (do they buy, and how fast?)
That’s enough to run a clear system.
📈 KPI definitions (simple and clear)
1) CTR (Click-Through Rate)
CTR answers: “Did our target audience care enough to click?”
Low CTR often means:
wrong audience
wrong channel
wrong hook
2) Bounce rate
Bounce answers: “Did they leave fast?”
High bounce often means:
promise mismatch (ad to page)
page too generic
wrong buyer persona words
3) Lead quality
Lead quality answers: “Are leads the right fit?”
Low quality often means:
target audience too broad
unclear “for/not-for” filter
weak positioning
4) Time on page
Time answers: “Did they trust enough to read?”
Low time often means:
confusing page
too much text
weak clarity early
5) CTA click rate
CTA clicks answer: “Did the next step feel safe?”
Low CTA clicks often means:
proof is missing near CTA
objections not answered
step is too big
6) Conversion rate
Conversion answers: “Did they take the step?”
Low conversion with high CTA clicks often means:
friction (forms, speed, mobile)
unclear “what happens next”
7) Close rate + time-to-yes (velocity)
Close rate answers: “Do they buy?”
Time-to-yes answers: “How fast do they decide?”
Slow velocity often means:
persona doubts not handled
offer step not matched to stage
missing 48-hour win
🧾 Spreadsheet template (copy this exactly)
Create a Google Sheet with one tab called: Dashboard
✅ Columns (left to right)
Week start date
Slice name (target audience + buyer persona label)
Channel (search/social/email/calls)
Page name (landing/homepage/offer)
CTR (number or trend)
Bounce rate (number or trend)
Time on page (trend)
CTA click rate (trend)
Conversion rate (trend)
Lead quality (good/ok/bad)
Close rate (trend)
Time-to-yes (trend)
Notes (top objection, top question)
Pro tip: If numbers feel hard, start with trends:
up / flat / down
Trends are still useful.
🎨 Thresholds (green / yellow / red)
We avoid fake benchmarks.
We use your own baseline.
✅ Baseline rule
Baseline = your last 4 weeks average for that slice and channel.
🟩 Green
Better than baseline.
🟨 Yellow
About the same as baseline.
🟥 Red
Worse than baseline.
This keeps it fair and honest.
🧠 The fix-first flow (what to fix when a KPI is red)
This is the most important part.
When something is red, don’t panic.
Follow the chain:
Step 1: If CTR is red
Fix targeting or hook first.
tighten target audience
test pain vs proof headline
match channel to intent
Step 2: If bounce is red
Fix promise match.
match ad headline to page hero
clarify the “For…” line
move CTA up
Step 3: If time on page is red
Fix clarity.
shorten hero
add a 3-step path early
use bullets, not walls of text
Step 4: If CTA clicks are red
Fix fear at the click.
put proof near CTA
add micro-FAQ under CTA
add “what happens next”
Step 5: If conversion is red
Fix friction.
reduce form fields
improve mobile
clarify next steps
Step 6: If lead quality is red
Fix fit filters.
tighten “For…” line
add “not for you if…”
adjust offer step
Step 7: If close rate or time-to-yes is red
Fix decision support.
add proof near pricing
add 48-hour win
add week-one plan
answer top objections
Fix one thing. Test one week. Repeat.
🧪 Weekly routine (15 minutes)
Here is the weekly cadence:
Update the dashboard row for your main slice
Mark green/yellow/red
Pick the first red KPI in the flow
Choose one tiny test
Run it for one week
Log what happened
That’s how we grow without chaos.
🧩 Tiny tests that match each KPI problem (quick menu)
If CTR is low
pain headline vs proof headline
tighter “For…” line
channel swap (search vs social)
If bounce is high
match ad copy to hero
move CTA higher
add proof near CTA
If CTA clicks are low
add micro-FAQ under CTA
add “what happens next”
add 48-hour win block
If conversion is low
fewer form fields
clearer next step
faster mobile page
If close rate is low
add “not-for” filter
tighten persona
add proof by role (B2B) if needed
🧠 How this helps you attract ideal clients
Ideal clients show up when:
the target audience is tight
the buyer persona message is sharp
the CTA feels safe
proof is in the right place
This dashboard helps you keep those aligned.
It turns “marketing” into “learning.”
🧠 Why this supports ranking for “buyer persona”
Search engines like:
clear definitions
repeatable frameworks
clean structure
helpful FAQs
This post uses “buyer persona” naturally in:
definitions
KPI explanations
troubleshooting steps
FAQ answers
That strengthens topical authority for buyer persona.
❓ FAQ — Dashboard for Target Audience and Buyer Persona
1) What is target audience fit?
Target audience fit means we are aiming at the right group and attracting the right clicks and leads.
2) What is buyer persona performance?
Buyer persona performance means our message matches buyer fears and desires, so they stay, click, and convert.
3) What KPIs should we track for target audience fit?
CTR, bounce rate, and lead quality are the fastest signals of target audience fit.
4) What KPIs should we track for buyer persona performance?
Time on page, CTA click rate, conversion rate, close rate, and time-to-yes show buyer persona performance.
5) How often should we update the dashboard?
Weekly. Weekly updates keep changes small and learning fast.
6) What does low CTR usually mean?
It often means the hook is wrong or the audience is wrong. Tighten targeting or test pain vs proof headlines.
7) What does high bounce usually mean?
Promise mismatch. The ad and the page hero don’t match, or the page feels too generic.
8) What does low CTA click rate mean?
Fear at the click. Add proof near the CTA and micro-FAQs under the button.
9) What if conversions are low but CTA clicks are high?
That usually means friction: forms are too long, mobile is hard, or next steps are unclear.
10) What is time-to-yes and why does it matter?
Time-to-yes is how long buyers take to decide. Faster time-to-yes usually means better buyer persona fit and clearer proof.
11) How do we choose what to fix first?
Follow the fix-first flow: CTR → bounce → time → CTA clicks → conversion → quality → close/velocity.
12) What is the simplest dashboard setup for beginners?
One sheet, one row per slice per week, trend tracking (up/flat/down), and one tiny test per week.
📌 Key Takeaways
Use one sheet to track target audience fit and buyer persona performance
Track 7 core KPIs: CTR, bounce, time, CTA clicks, conversions, lead quality, close rate/time-to-yes
Use baseline trends (green/yellow/red) instead of fake benchmarks
Follow the fix-first flow to choose the right next improvement
Run one tiny test per week and log results
This is buyer clarity inside The Buyer Clarity System™
🎁 Complimentary Ebook
Want the one-sheet dashboard template, fix-first flow chart, and tiny test menu?
Grab our COMPLIMENTARY Buyer Clarity Guide here:
👉 Download your complimentary ebook now
🧭 Final Word
Clarity is not a feeling.
It’s a system.
Track target audience fit. Track buyer persona performance. Fix the first broken link. One win per week.
That’s how ideal clients find you—inside The Buyer Clarity System™.
